I have started the development of the code that will run on the RPI 3.
Here is the link to the github repository:
If you have any suggestion, comments or want to contribute to the code, let me know.
I have decided to start from the end, the Front End.
But, before talking about how I have designed and built my UI, I need to give you a quick overview about the Messaging Infrastructure.
The communication between all the devices (equipped with sensors) and the Hub/Gateway is all based on MQTT protocol, over WI-FI.
In the near future I plan to add some Z-Wave devices (lights and plugs), but for now the underlying network is Wi-FI.
I don’t need to spend much time about MQTT, I Have written many blog’s posts on why it is the best and most widely used messaging protocol in IoT (Have a look at my previous posts).
The MQTT broker used is Eclipse Mosquitto 1.4, installed on a Raspberry PI 3 (RPI 3).
Every 30 seconds from each one of the rooms in my House an MQTT msg is sent to a dedicated topic. The serialization format chosen is JSON and a message carries several readings (Temperature, Humidity, Pressure, Light).
In addition, the same messaging approach is used to send commands and configuration changes from the Hub to a device (but I’ll address this side of the communication in another post).
Having said that, every information comes to the MQTT broker. You need only to subscribe to a Topic or a set of Topics and you will receive the information, every 30 sec., in JSON format.
I have setup OpenHAB 2, and OpenHAB has a nice Mobile UI and can directly bind items on the UI to MQTT topics.
But, I wanted also to develop a Nice and Responsive custom UI, without, if possible, writing too much code.
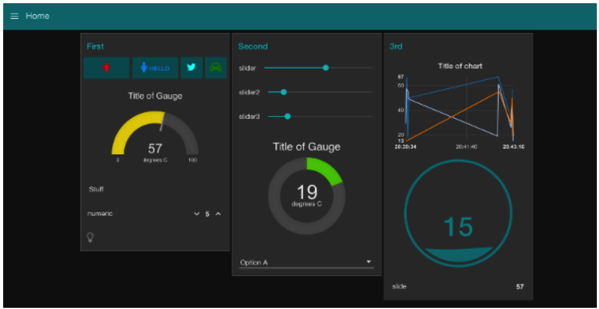
After many investigation, I discovered that there is a set of Node for Node-RED making really easy to develop a Web Front End.
These nodes are part of the module: node-red-dashboard, that I have installed in the Node-RED directory
(see: https://www.npmjs.com/package/node-red-dashboard)
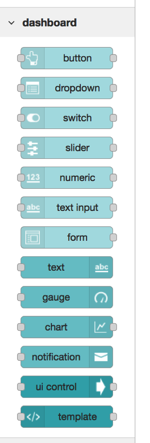
After having installed it, you see a nice new set of nodes in the Node-RED palette:
Therefore, these are the main points behind Message Elaboration and UI:
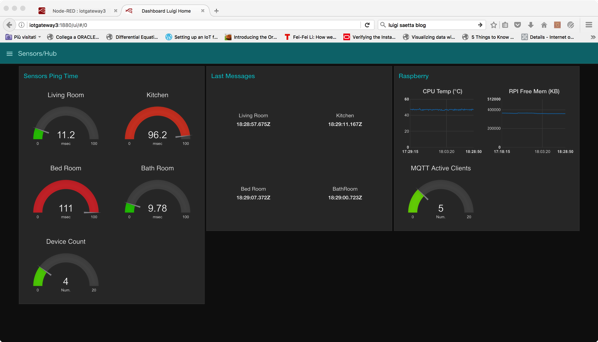
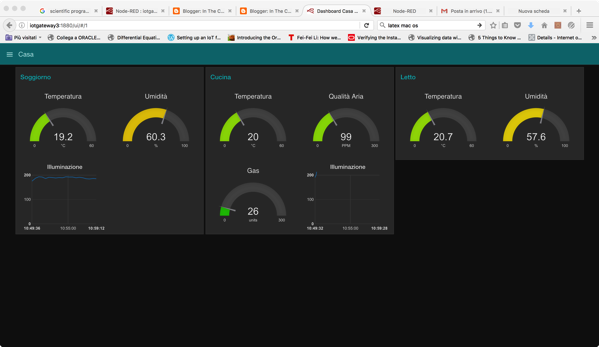
All the Widgets are arranged in two Tabs:
Here you see a snapshot of the First Tab:
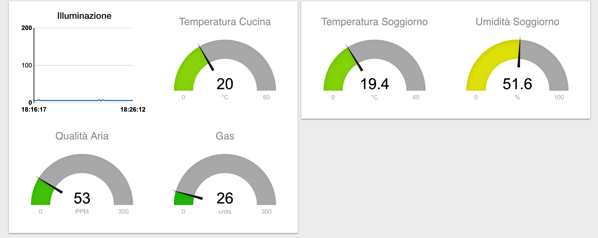
One of the important feature that I have added is a measure of the Air Quality and Gas concentration in the Kitchen (Group in the middle, above), useful, for example, to verify if there is a Gas Leak or if, during cooking for example, the Quality of the Air becomes too bad (can be, if windows are closed).
In the near future I plan to add also Alerts. One possible choice is to implement rules in Node-RED flows. I’m investigating the best way (if you have suggestions, please leave a comment!)
To have an insight in the Infrastructure, I gather and display several information:
All the message elaboration (+ UI generation ) is organized in three flows:
To give you an idea, here you see the flows dedicated to elaborate and display messages coming from the Rooms.
To add more details, here you see the flow dedicated to elaborate and display messages coming from the device located in the bathroom
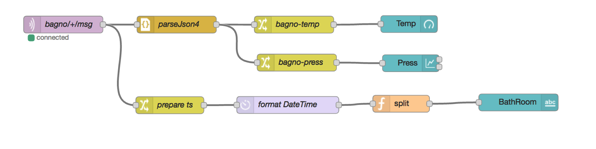
(bagno, is the Italian word for BathRoom).
The + wildcard is there to enable, in the future, to have more devices in the same room, each one with a dedicated topic.
The upper part transforms the MQTT message (a string) in a JSON object. Then the two information (Temperature and Air Pressure) are extracted with a dedicated Change Node. The most important nodes from UI are the last (right). These nodes (coming from node-red-dashboard) implement the UI. Temperature is displayed in a Gauge and Pressure with a Chart (from the point of view of Weather Forecast what is more relevant is the Pressure trend).
The lower part registers the timestamp of the message arrival and display it in a Text Widget. In this way I can easily detect if, for some reason, one device has stopped sending messages.
The nice thing is that the UI is really responsive: every time a new message arrives it is updated and. Information are pushed from Node-RED server to your browser, and you don’t need to refresh the browser. Really Cool. (I think it is based on WebSocket, but not sure till now).
Well, if you want some more details and code (JSON representation of flows) post a comment and I’ll see.
Stay tuned. This is only the beginning.

I’m preparing, for my work, a presentation on IoT and researching.
I was searching some more detailed information regarding Edison power consumption.
By chance I came across several benchmarks comparing Edison with RPI 2.
It was my surprise to discover that Edison is as powerful as (if not more powerful) than RPI 2.
Worth to have a look:
Mooc from companies like Coursera are a great way for improving your knowledge and acquire new skills and competencies.
I have recently completed this course on IBM IoT Cloud platform
https://www.coursera.org/learn/developer-iot
I have found really interesting:
If you need more insight into IBM Bluemix IoT and in general IoT Cloud platforms, I would recommend this course. Worth spending some euro to get a Verified Certificate.
I’m progressing, in the free time, my evaluation of Cloud IoT platforms.
As I wrote in a previous blog post, IBM IoT platform is really interesting. One of her strong point is NodeRED, a Visual Programming Language for IoT and Integration, built on top of NodeJS.
I have upgraded my Raspbian Jessie image on my RPI. With the upgrade I have found a new version of NodeRED.
Inside I have discovered, already installed, nodes to communicate with IBM IoT Watson. Nice.

If you want to measure the temperature of the CPU of your Raspberry PI, you can simply issue the command
root@iotgateway1:~# vcgencmd measure_temp
temp=46.0'C
A little bit hot!
Next thing I'm going to explore is Node-Red.
Node-Red is a Visual Language, developed by IBM Emerging Technologies, that can be used to rapidly develop integration flows for IoT Application.
It is based on JavaScript and NodeJS.
It is available as part of IBM Bluemix PaaS, but since it is OpenSource you can install it on any environment where NodeJS is available. For example you can install it on a Raspberry PI or on a Intel Edison Board.
I have already written a short post on the subject:
http://lsaetta.blogspot.it/2016/04/visual-integration-tools.html
Stay tuned for updates on the subject!
The next step has been configuring the RabbitMQ broker I have installed on my RPI to use TLS/SSL
It has worked.
The configuration file is located under /etc/rabbitmq
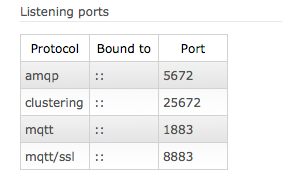
This is the final configuration, enabled for SSL and MQTT.
MQTT port used is 8883 (the default).
[{rabbit, [{loopback_users, []},
{ssl_options, [{cacertfile,"/etc/rabbitmq/certs/ca.crt"},
{certfile, "/etc/rabbitmq/certs/server.crt"},
{keyfile, "/etc/rabbitmq/certs/server.key"},
{password, “<insert here>"}
]}
]},
{rabbitmq_mqtt, [{default_user, <<"guest">>},
{default_pass, <<….>>},
{allow_anonymous, true},
{vhost, <<"/">>},
{exchange, <<"amq.topic">>},
{subscription_ttl, 1800000},
{prefetch, 10},
{ssl_listeners, []},
%% Default MQTT with TLS port is 8883
{ssl_listeners, [8883]},
{tcp_listeners, [1883]},
{tcp_listen_options, [{backlog, 128},
{nodelay, true}]}]}
].
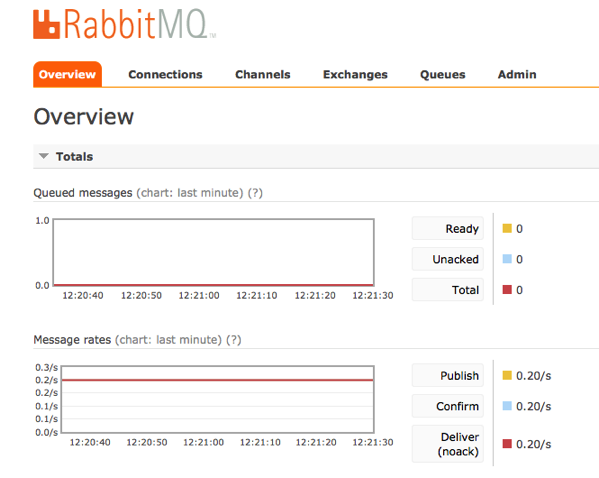
From the RabbitMQ Web UI, accessible at the URL:
http://iotgateway1:15672/#/
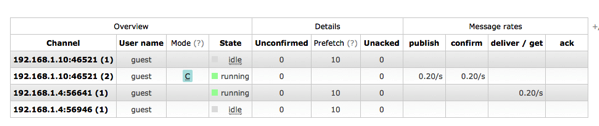
you can easily monitor the flow of messages.
I decided to try to see if it was possible, and how difficult, to develop a configurable Java program for Intel Edison.
What do I mean as configurable?
I wanted a Java program able to run and:
1. Read a set of analog sensors connected, in a continuous loop
2. Be able to specify through a configuration file (config.properties) the type of sensors and the pins used
3. Be able to send a MQTT message to a MQTT broker, containing all the readings from sensors
4. Be able to specify the broker destination in the config file.
It is still a trial, but I succeeded. The configurable parameters are:
1. Type of sensor.
2. Pins used
3. Interval between readings
4. URL of the broker
One of the problems was that the UPM classes have not a uniform interface. For some classes the method to be used is getValue(), for others a different signature.
Therefore I have defined a Sensor Interface and a set of classes, extending the UPM class for the relative sensor and implementing the Sensor Interface.
This way all the object created for sensors are inserted in a List<ISensor> and I can literate.
The repository for the code is:
https://github.com/luigisaetta/edison-java-projects/tree/master/RoomStation
Inside you can also find an example for the config.properties.
For the tests I have used:
1. Intel Edison, with Arduino Board;
2. Grove Shield
3. Grove Temp, Grove Light and Grove TP401 Gas sensor
4. RabbitMQ MQTT broker, installed on a RPI.
This is the format of JSON msgs sent. Formatted using Google GSON library.
The nice thing with Docker is that you can easily and quickly setup an environment where you can test new products.
In my IoT Gateway the MQTT broker is Mosquitto. It works fine. But it has no monitoring interface.
I’m thinking about to test RabbitMQ as MQTT broker. It has a nice Web UI, with monitoring and admin capabilities. It is a little bit more complicated (RabbitMQ doesn’t start natively with MQTT, you need to enable a plug-in) but it can be installed on RPI.
I decided to run a quick test following my colleague G. Provinciali blog’s advice:
https://devopschannel.com/2016/05/12/docker-weblogic-e-kitematic/
I installed Docker and Kitematic GUI on my MacBook and then I downloaded Docker's official RabbitMQ image.
Then, some steps to enable MQTT and expose port 1883 and… it was working.
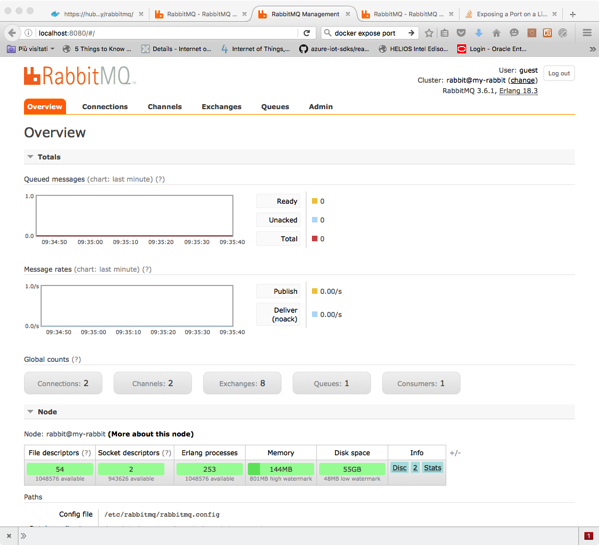
and here a screenshot of RabbitMQ Web UI.
As client, I have used mosquitto_sub and Eclipse Paho GUI client. Worked fine.
Ok, next step is installation on RPI. Stay tuned.